Demo session on NetworkX python package
- Authors: Annika Rockenberger and Anne Fouilloux
- Lesson Topic: NetworkX python package

Network analysis lesson
A newly created lesson from Annika can be found here
Minutes of the studyGroup@UiO demo session
When: 21st September 2018, 14:00-16:00
Dataset used for this lesson
We will be using example datasets from Easy Linavis (Easy Literary Network Analysis and Visualization). On this website, examples can be found in the tab “examples”.
Easy Linavis (ezlinavis) generates CSV files with network data from simple segmentations of dramatic texts. In the left column, you can list segments (chapters, acts, scenes, etc.) and characters appearing or speaking in a given segment. Segments are indicated with a hashtag and they can be hierarchical, e.g.:
# First Act
## First Scene
Character 1
Character 2
Easy Linavis will automatically generate a CSV file with node-node relations (source, type, target, weight) in the column in the centre. Data changes as you type: as soon as you change something in the first column, the mid-column changes accordingly. The “type” column in the CSV file is always “undirected” here, but we inserted it so you can directly work with the CSV files in Gephi. The network graph in the right column is also generated live, using a spring-embedded layout, just to give you a first impression of what your network data looks like. To make it easier to understand how ezlinavis works, we provide some example files which can be accessed via the corresponding drop-down menu in the right upper corner. ezlinavis was developed in 2017 by Carsten Milling and Frank Fischer, using the React and Sigma JS libraries. It is mainly meant for didactic purposes (we are mainly resorting to it in our workshops on the network analysis of literary texts), although in principle it is also suited to handle bigger network data. If you want to contact us, please drop a line to ffischer(at)hse.ru.
Other datasets and information
- https://textology.hypotheses.org/37
- https://github.com/arockenberger/InnsbruckEasterplay
- Complex Network Analysis in Python: based on NetworkX version 1.X and not the new version 2.X. Information on how to migrate from 1.X to 2.X can be found at https://networkx.github.io/documentation/stable/release/migration_guide_from_1.x_to_2.0.html.
Other tools
Another tool that is freely available is Gephi https://gephi.org/. To be fully functional, you need an up to date version of java. Gephi is a very handy tool for creating nice network plots, especially if you want to publish them. To use it, download a file from Easy Linavis (as a csv file) and use it in Gephi or create your own csv.
Codes used for the demo
Annika has prepared several jupyter notebooks:
- A follow-along notebook for the textbook on complex network analysis (up tp chapter 5, will be continued) https://github.com/arockenberger/InnsbruckEasterplay/blob/master/CNA_tests.ipynb – A notebook for doing cna with material from the Innsbruck Easterplay https://github.com/arockenberger/InnsbruckEasterplay/blob/master/InnsOS_charnet.ipynb
To make use of NetworkX python package, you need to import it:
import networkx as nx
We use nx as a shortcut to avoid writing networkx everytime we call a function from NetworkX python package.
- To define a new graph, use Graph method:
G = nx.Graph([("A", "eggs"),])
It defines a new graph with two nodes “A” and “eggs” connected to each other. You need to give a list of connections (one connection is represented by two “nodes”).
To print all the nodes:
print(G.nodes)
To print all the connections, or edges:
print(G.edges)
To add new nodes:
G.add_node("spinach") # add a single node
G.add_nodes_from(["folates", "asparagus", "liver"]) # add a list of nodes
To add a new connection – edge – between nodes:
G.add_edge("spinach", "folates") # add one edge, both ends exist
G.add_edge("spinach", "heating oil") # add one edge
G.add_edge("liver", "Se") # add one edge, one end does not exist
G.add_edges_from([("folates", "liver"), ("folates", "asparagus")]) # add list of edges
Tips:
- no weight by default (need to ask NetworkX to compute them, but can be assigned as attributes manually)
- not directional by default; use DiGraph() and/or MultiGraph() for directional networks.
- when defining new connections( add_edge or add_edges_from), a new node is created if it does not exist yet. SO BE CAREFUL WITH THE NAMES OF THE NODES (typos, letter cases, etc.)
To plot a graph with networkx:
nx.draw(G)
It plots nodes and associated connections.
- To delete nodes and connections:
G.remove_node("Hg") # removes this node
G.remove_nodes_from(["Hg",]) # removes a missing node from a list
G.remove_edge("spinach", "heating oil") # removes edge between these nodes
G.remove_edges_from([("spinach", "heating oil"),]) # removes edges from a list
G.remove_node("heating oil")
Tips
You get an error if you try to remove a node that does not exist (same with a connection)
Examples
We will now work with “real” examples i.e. read a network from a csv file. We are using “Elizabeth Inchbald: Lover’s Vows (1798)” from Easy Linavis.
To read a csv file, the easiest is to use pandas python package:
import pandas as pd
df = pd.read_csv("data/Elizabeth1798.csv")
df.head()
        Source	Type	       Target	     Weight
0	Agatha	Undirected	Amelia	        1
1	Agatha	Undirected	Anhalt	        2
2	Agatha	Undirected	Baron	        1
3	Agatha	Undirected	Cottager	3
4	Agatha	Undirected	Countryman	1
The file contains quite a large number of rows so we printed only the first rows (5 first rows) using head().
- To create a Graph from a pandas dataframe:
# create a graph using Source and Target for connections.
G = nx.from_pandas_edgelist(df, 'Source', 'Target')
nx.draw(G)
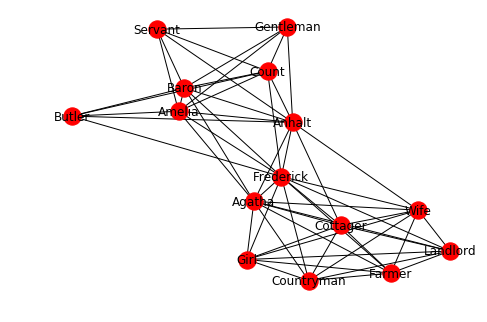
from_pandas_edgelist takes a pandas dataframe and the two column names used as “Source” and “Target”.
See documentation online for more information on from_pandas_edgelist.
- Have a look at Lars Johnson’s (National Library of Norway) jupyter notebook at https://github.com/arockenberger/NB_API_Python for visualization.
AOB
We also discussed how to host, write and publish an academic blog on the free to use, open access blog platform Hypotheses.org https://hypotheses.org/. The blogs are indexed by major libraries and journal indexing services and you can apply for an official ISSN. Hypotheses is open for all languages, the four main languages with several thousands of academic blogs are Spanish, French, German and English.
- You can host and publish your own blog by using, for example, Wordpress or Drupal (Content Mangement Systems, CMS). The offer a great variety in layouts and templates for a website that has not just static content. If you decide to buy hosting services, there’s plenty to choose from. It doesn’t have to be costly, but be aware that the cheapest option isn’t necessarily the best. You must put a GDPR statement on your site if you use a CMS!